Spectral Analysis
Why study spectral analysis?
Spectral analysis gives us a new lense for analyzing ordinary time series data. Below are some notable example applications (Taken from "Spectral Analysis for Univariate Time Series" by Percival & Walden (2020)):
- Testing theories with observations: Scientist predicted that there should be a peak in the spectrum in the low-frequency range for wind speed data (the macrometeorological/synoptic peak). To test this theory, wind speed data was transformed to the spectral domain.
- Uncovering hidden information in data: Ecologist Lawrence R. Walker answered the question "does rain fall randomly or in a pattern?" using spectral analysis. In the spectral domain, a clear answer emerged... it falls in a pattern!
- Discriminating data: A study investigated how babies neurologically react to a flash of light (Jones et al., 1972). Prominent differences were recorded in the spectrum of brain wave patterns before and after light exposure.
- Evaluating model fitting: Imagine you want to fit a time series to some function. If you find the spectrum of the time series, you can subtract a theoretical spectrum (such as ARIMA) and analyze the residuals. A good fit will return white noise (no leftover structure).
The Story of Spectral Analysis:
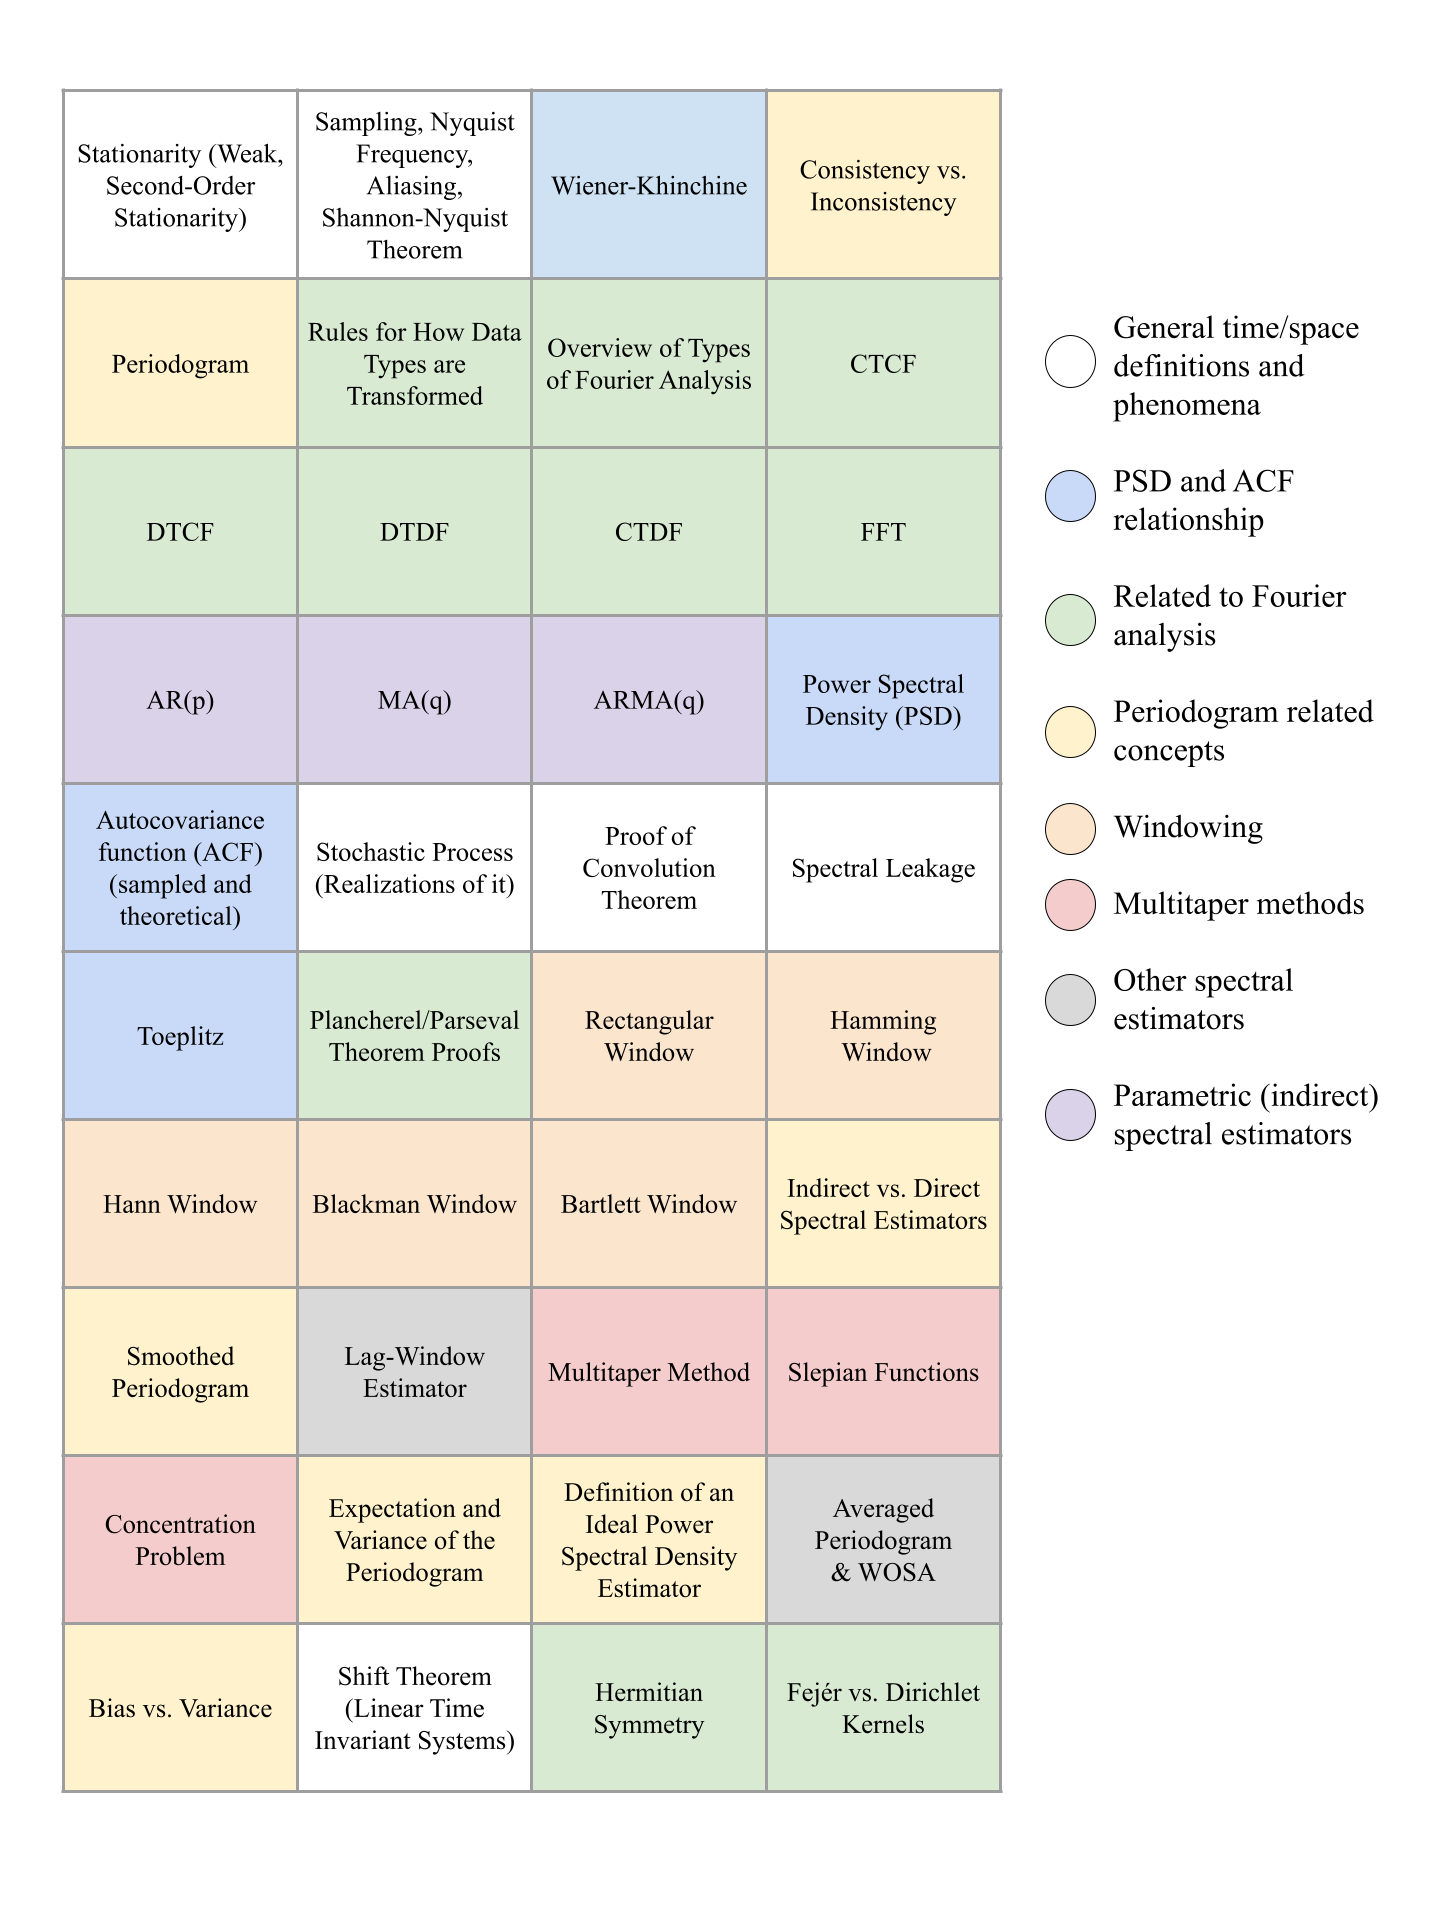
We observe one finite realization of a weakly stationary stochastic process. Stationarity gives an autocovariance depending only on lag. We use the Wiener–Khinchin theorem to arrive at the power spectral density function (PSD). The periodogram estimates that PSD, but finite observation causes leakage and high variance, so we use tapering, smoothing, averaging, or multitapering to trade bias and variance.
Click on the buttons below to know more information!
back